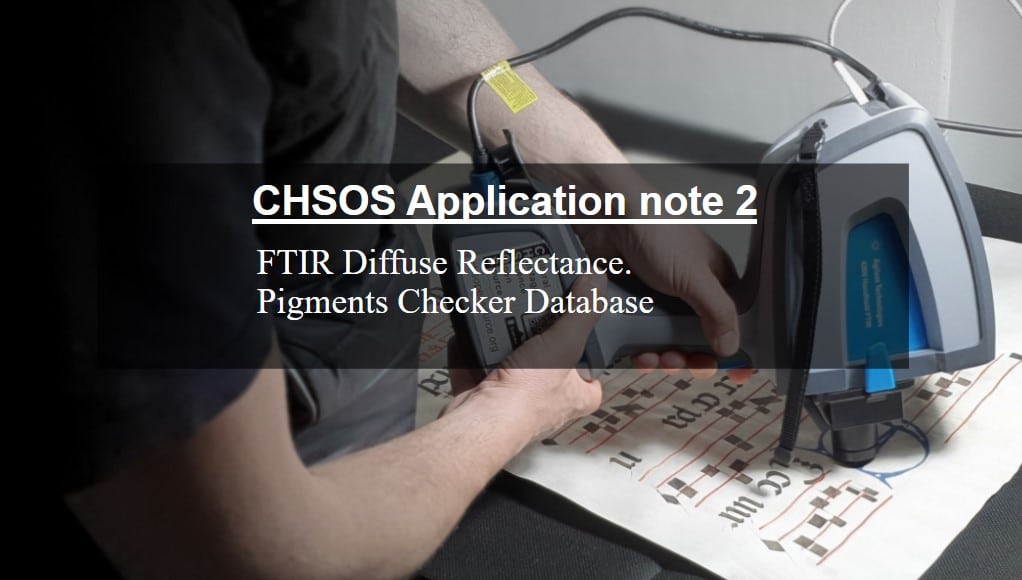
CHSOS Application note # 2: FTIR Diffuse Reflectance. Pigments Checker Database
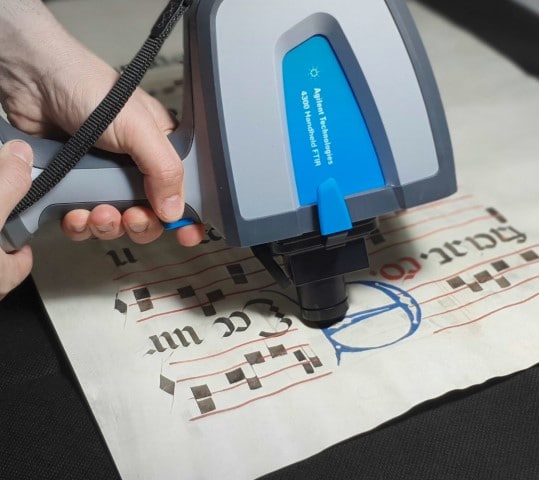
We perform molecular analysis using an Agilent 4300 Handheld FTIR spectrometer. This system enables direct, non-invasive analysis of artworks and archaeological objects on their surfaces, without any damage or sampling. The technique, known as FTIR Diffuse Reflectance Spectroscopy, is a powerful tool for FTIR Spectroscopy for Art Examination, providing valuable information on the molecular composition of cultural heritage materials. The method requires a specialized diffuse reflectance probe for in situ measurements.
This method differs significantly from standard FTIR spectroscopy for Art Examination and can produce very different results. Therefore, researchers must develop new spectral databases for historical pigments and other materials used in art and archaeology.
Standard FTIR spectroscopy has been widely used in this field [1]. Its spectra are relatively easy to interpret since the IR radiation is either absorbed or transmitted. In contrast, FTIR Diffuse Reflectance involves additional scattering, which makes interpretation more complex. Scattering can vary significantly—even between samples of the same material [2]—leading to spectra that differ from those in standard databases.
CHSOS supports this effort by publishing spectra from the Pigments Checker, our reference collection of historical pigments from antiquity to the early 1950s. We applied the pigments with an acrylic binder on cardboard supports and collected spectra of both the pigments and the binder alone. All spectra are freely available on the Pigments Checker webpage.
Pure powder pigments – FTIR spectroscopy for Art Examination
The FTIR-DR spectrum of a pigment in the Pigments Checker (Figure [1]) reflects contributions not only from the pigment itself, but also from the acrylic binder and the cardboard support (100% cotton paper). As a result, we cannot clearly identify the absorbance bands of each individual pigment.
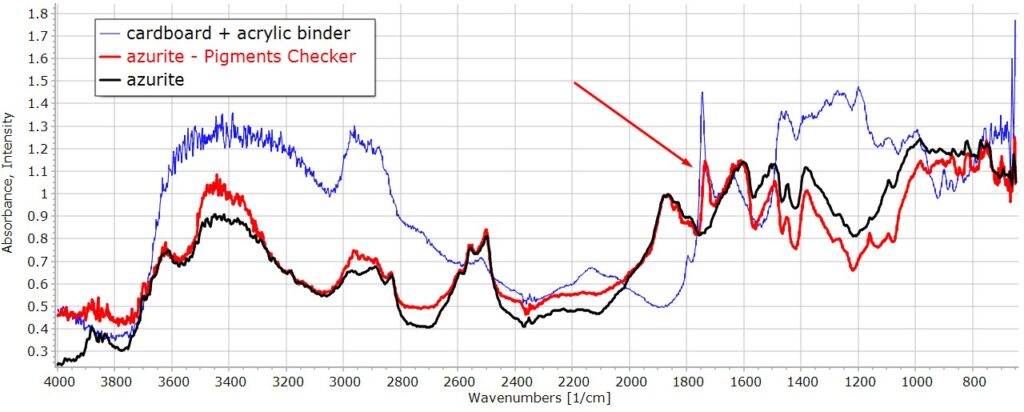
Figure [2], for example, compares the spectrum of pure azurite powder with that of the azurite swatch in the Pigments Checker. This comparison shows the importance of having spectra of pure powder pigments to correctly interpret the spectra from painted surfaces.
To address this need, we created a spectral database of pure powder pigments. Users can download this database, along with the others, from the Pigments Checker webpage.
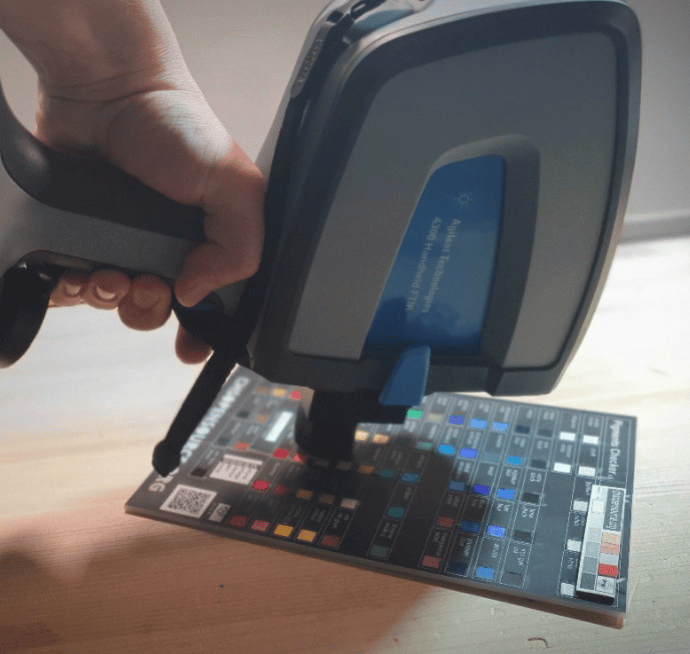
Checker.
In order not to contaminate the probe, the spectra of the pure pigments were acquired by depositing some powder on an IR transparent window, which does not affect the resulting spectrum, figure [4].
This window is then loaded on the probe, figure [5].
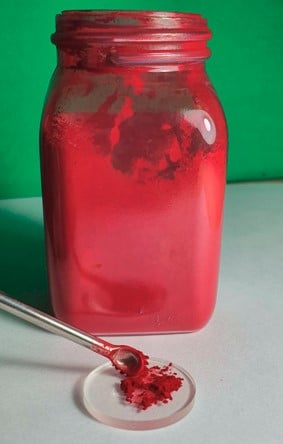
![Figure [5]. The IR transparent window holding the powder pigment is loaded on the probe for
the spectrum acquisition.](https://chsopensource.org/wp-content/uploads/2022/04/ftir-pigments-5-1-1024x533.jpg)
the spectrum acquisition.
Case study: antiphonary
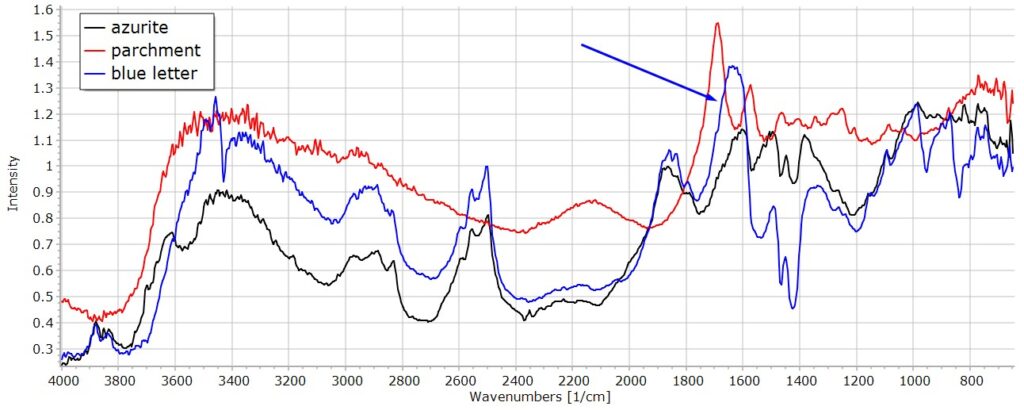
We tested a large (68 x 47 cm) three-color antiphonary parchment sheet, 16th century, figure[6]. Figure [7] shows the spectra of the parchment, the blue color of a letter, and the spectrum of pure azurite in our database. Availability of the pure spectrum of azurite is mandatory for a correct interpretation.
Conclusions
FTIR Spectroscopy for Art Examination: Non-invasive FTIR using a diffuse reflectance probe is a relatively new and rapidly developing field. While conventional FTIR spectra are generally straightforward to interpret, diffuse reflectance measurements often require the support of spectral databases for reliable identification. This application note discusses spectra acquired from the Pigments Checker reference target, alongside a database collected from powdered pigments. Comparing these datasets helps illustrate the influence of binders on pigment spectra and highlights important considerations for FTIR spectroscopy for Art Examination. Future application notes will explore the effects of different binders on the same pigments and their impact on spectral interpretation.
References
[1] DERRICK, M. R., STULIK, D., & LANDRY, J. M. (1999). Infrared spectroscopy in conservation science. Los Angeles, Getty Conservation Institute. http://www.getty.edu/conservation/publications/pdf_publications/infrared_spectroscopy.pdf.
[2] MILOSEVIC, M., & BERETS, S. L. (2002). A REVIEW OF FT-IR DIFFUSE REFLECTION SAMPLING CONSIDERATIONS. Applied Spectroscopy Reviews. 37, 347-364.
Learn Technical Photography for Art Examination
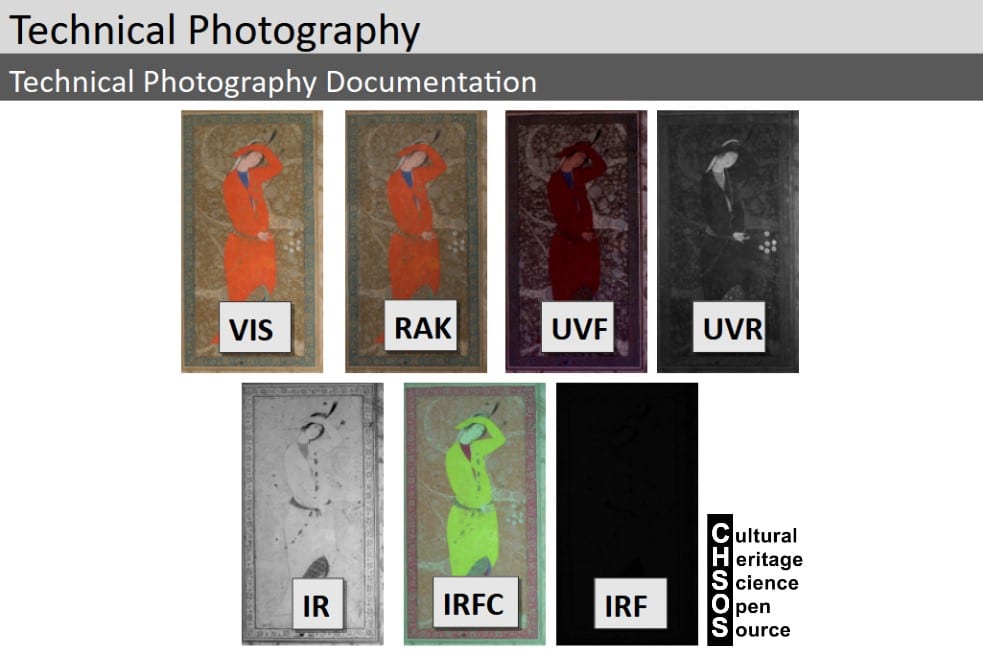
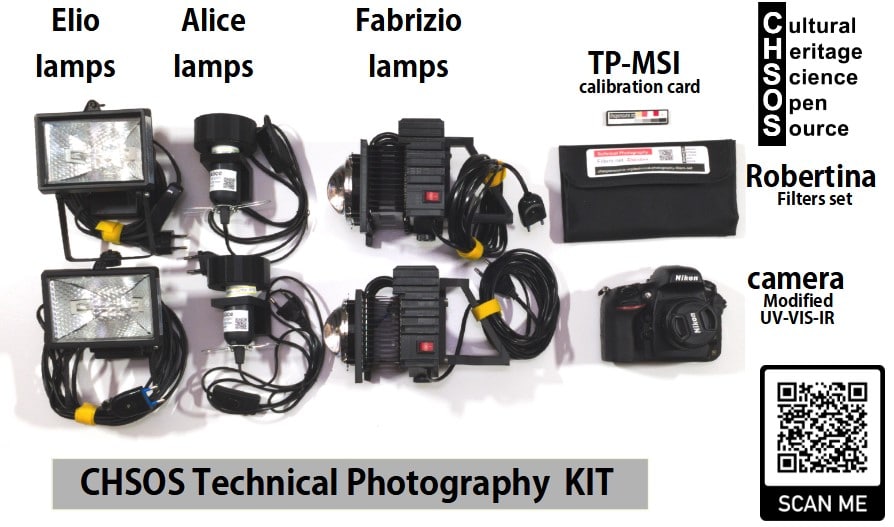
Technical Photography is one of the most powerful—and often overlooked—tools for the scientific examination of art and archaeology. If you are a conservator, scientist, or art collector and you are not yet familiar with this method, it is truly a missed opportunity. Using simple, affordable equipment and a clear methodology, Technical Photography allows you to reveal underdrawings, retouchings, material differences, and conservation issues in a completely non-invasive way. Far from being complex or inaccessible, it is an easy entry point into scientific analysis. In many cases, Technical Photography represents the first essential step toward a deeper understanding of artworks and archaeological objects.


Scientific Art Examination – Resources:
Getty Conservation Institute (GCI) – USA
The British Museum – Scientific Research Department – UK
Scientific Research Department – The Metropolitan Museum of Art, New York, USA
C2RMF (Centre de Recherche et de Restauration des Musées de France) – France
Rijksmuseum – Science Department – Netherlands