Near-Infrared Reflectance Spectroscopy (NIR-RS) works in the range 930-1690 nm.
This technique involves measuring the reflectance of near-infrared light from a surface, providing valuable information about the composition and structure of the materials being examined.
Visit our Near-Infrared Reflectance Spectroscopy webpage to check our equipment, download our free spectra database and watch our tutorials https://chsopensource.org/near-infrared-reflectance-spectrometer/
Advantages of Near-Infrared Reflectance Spectroscopy
1. Non-Destructive: One of the most significant advantages of NIR-RS is that it is non-destructive, meaning that it does not harm the artwork. This is essential for preserving the integrity of valuable and often irreplaceable pieces.
2. In Situ Analysis: NIR-RS can be performed on-site without the need to remove samples from the artwork. Portable NIR-RS instruments allow for analysis in museums, galleries, and other locations where the artworks are displayed or stored.
3. Rapid and Efficient: The technique provides rapid results, allowing for the quick analysis of multiple areas of an artwork. This efficiency is beneficial in large-scale surveys or when time-sensitive decisions are needed in conservation.
4. Complementary Technique: NIR-RS can be used alongside other analytical techniques such as X-ray fluorescence (XRF), Fourier-transform infrared spectroscopy (FTIR), and Raman spectroscopy to provide a comprehensive understanding of an artwork’s composition and structure.
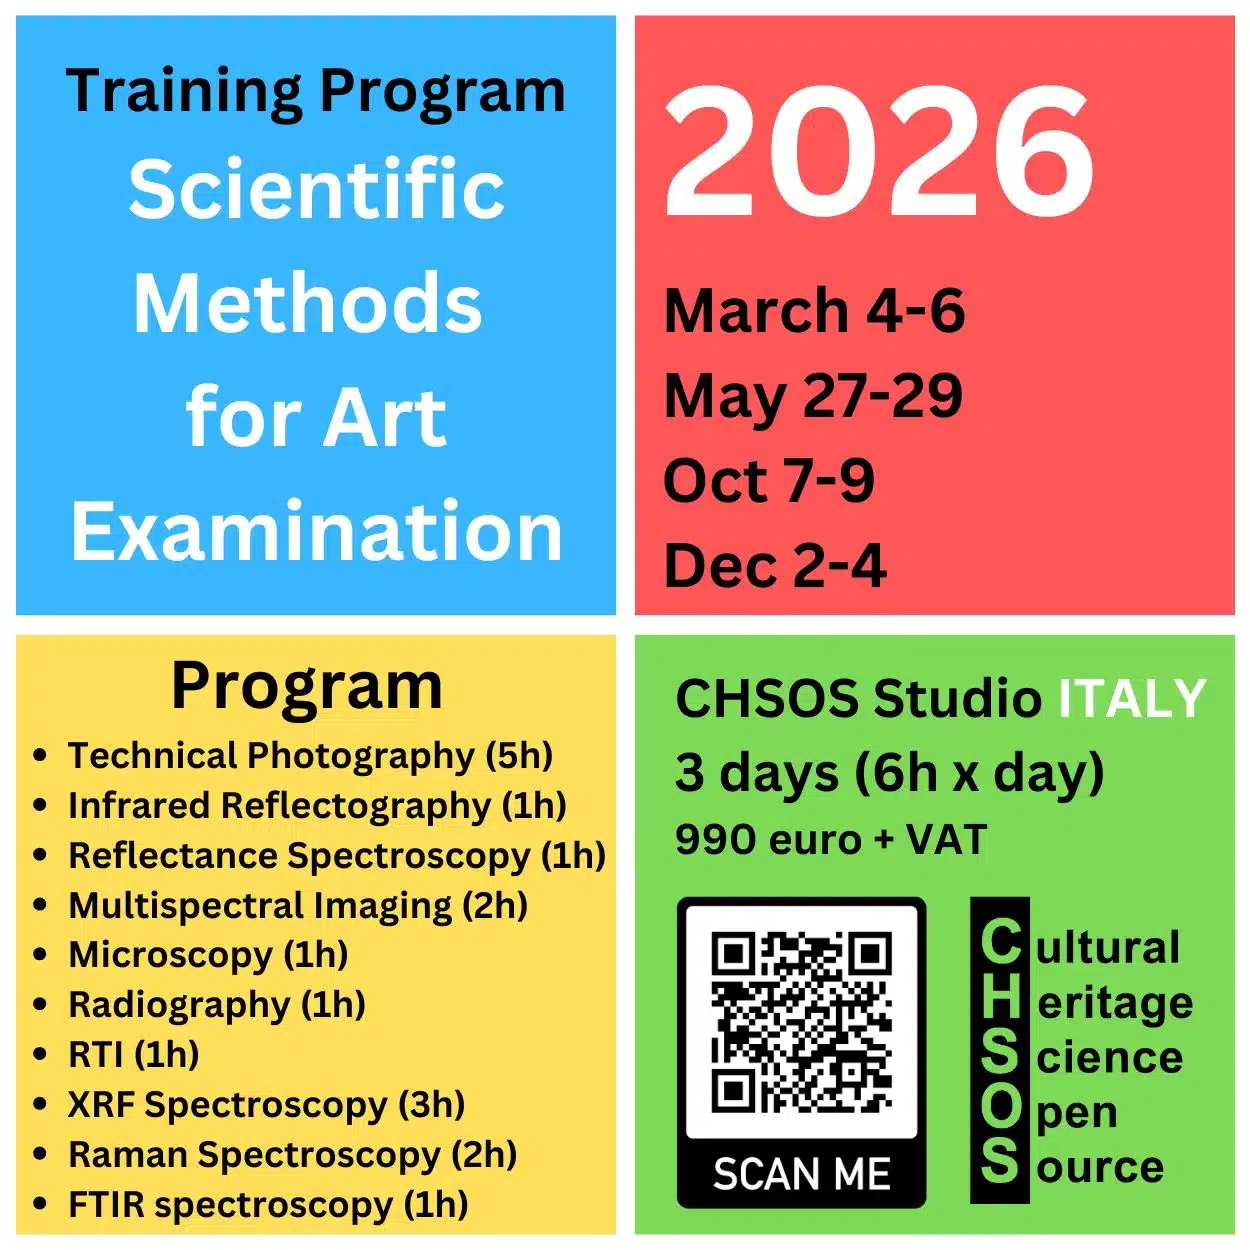
This lesson covers the use of the reflectance spectrometer in the Near Infrared (NIR) region and its applications for pigment identification.
Case Studies
In this video, we identify azurite on an antiphonary parchment (16th century).
This is the first class of the course, dedicated to the Near-Infrared Reflectance Spectrometer for Art Examination.
The instrument we use is a reflectance spectrometer equipped with an InGaAs detector, operating in the near-infrared range from 930 nm to 1670 nm. In this first lesson, we examine a parchment containing different materials: blue and red pigments, as well as ink.
Reflectance spectroscopy works very well for certain pigments, while for others it does not provide distinctive spectral features. However, when characteristic absorptions are present, this technique becomes extremely powerful. Its main advantage is that it delivers useful information in just a few seconds, non-invasively and without any sampling. Whenever the method is applicable, it is an excellent analytical solution.
We begin by starting the acquisition software. The first step is calibration, which is performed using a Spectralon white reference. After turning on the lamp, we acquire the background. Switching to reflectance percentage mode, we obtain a flat line, indicating that the calibration is correct and the system is ready for measurement.
We then proceed to measure the materials on the parchment. We start with the parchment itself, since it represents the background contribution in reflectance spectroscopy. After averaging several scans, we acquire its spectrum. Next, we measure the blue pigment.
At this point, we load both spectra into Spectragryph, a software used for comparing Raman, FTIR, and reflectance spectra. The parchment spectrum appears in black, while the blue pigment spectrum is shown separately.
Examining the blue spectrum, we observe an absorption feature around 1500 nm that is not explained by the parchment alone. This absorption band is a key diagnostic feature. By comparing the spectrum with reference data available in the Pigments Checker database on chsopensource.org, we find an excellent match with azurite. The absorption near 1500 nm is characteristic of this pigment.
Using this simple, portable, and fast technique, we can therefore confidently identify the blue pigment as azurite.
This video demonstrates the NIR-RS analysis of a blue watercolor wash from a Winsor & Newton color chart book, dated 1912.
This is the second class of the course, dedicated to Near-Infrared Reflectance Spectroscopy for Art Examination.
For this lesson, I brought a historical reference book: Modern Watercolor Pigments, edited by Winsor & Newton in 1912. Inside the book, there is a beautiful color chart containing original watercolor washes produced by Winsor & Newton themselves.
We will use these watercolor samples to test our equipment. In particular, we focus on Plate 4, and on the first row, where we find a vivid blue pigment identified as cobalt blue. Our objective is to verify whether this wash is truly made with cobalt blue pigment.
We position the probe on the cobalt blue wash and begin the spectral acquisition. After the countdown, the reflectance spectrum is recorded.
Next, we compare this measured spectrum with the reference spectra in our database, which was created using the Pigments Checker and the same reflectance spectroscopy setup. The acquired spectrum of the Winsor & Newton cobalt blue wash is loaded into Spectragryph and directly compared with the reference cobalt blue spectrum.
The result shows an excellent match: the two spectra overlap almost perfectly. This confirms that the watercolor wash in the Winsor & Newton chart is indeed made with genuine cobalt blue pigment.
Learn Reflectance Spectroscopy


Scientific Art Examination – Resources:
Getty Conservation Institute (GCI) – USA
The British Museum – Scientific Research Department – UK
Scientific Research Department – The Metropolitan Museum of Art, New York, USA
C2RMF (Centre de Recherche et de Restauration des Musées de France) – France
Rijksmuseum – Science Department – Netherlands